Multiple Choice
Identify the choice that best
completes the statement or answers the question.
|
|
|
1.
|
Choose the best estimate for 55° in radians.
|
|
|
2.
|
Choose the best estimate for 136° in radians.
|
|
|
3.
|
Choose the best estimate for the central angle in degrees. 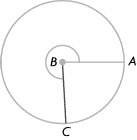
|
|
|
4.
|
Choose the best estimate for the central angle in degrees. 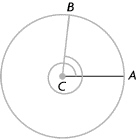
|
|
|
5.
|
Choose the best estimate for the central angle in radians. 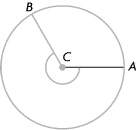
|
|
|
6.
|
How many turning points does the graph of y = sin x have from
0° to 360°?
|
|
|
7.
|
Which of the following is not an x-intercept of the graph of y =
sin x?
|
|
|
8.
|
Determine the midline of the following graph.  A. | y = 2 | B. | y = 3 | C. | y =
4 | D. | y = 5 |
|
|
|
9.
|
Determine the midline of the following graph.  A. | y = 2 | B. | y = 3 | C. | y =
4 | D. | y = 5 |
|
|
|
10.
|
Determine the amplitude of the following graph. 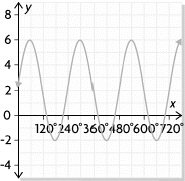
|
|
|
11.
|
Determine the amplitude of the following graph. 
|
|
|
12.
|
Determine the period of the following graph. 
|
|
|
13.
|
Determine the period of the following graph. 
|
|
|
14.
|
Determine the range of the following graph.  A. | {y | 0 £ y £ 8, y Î R} | B. | {y | –2
£ y £ 6, y Î R} | C. | {y | –4 £ y £ 8, y Î R} | D. | {y | y Î R} |
|
|
|
15.
|
Determine the range of the following graph. 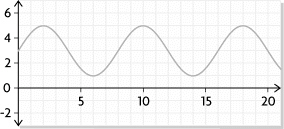 A. | {y | 1 £ y £ 5, y Î R} | B. | {y | –2
£ y £ 2, y Î R} | C. | {y | 0 £
y £ 4, y Î
R} | D. | {y | y Î
R} |
|
|
|
16.
|
Determine the range of the following graph. 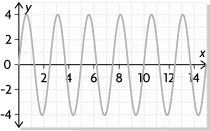 A. | {y | –8 £ y £ 8, y Î R} | B. | {y | –4
£ y £ 4, y Î R} | C. | {y | 0 £
y £ 15, y Î
R} | D. | {y | y Î
R} |
|
|
|
17.
|
A sinusoidal graph has an amplitude of 10 and a maximum at the point (18, 5).
Determine the midline of the graph.
A. | y = 0 | B. | y = –5 | C. | y =
13 | D. | y = 8 |
|
|
|
18.
|
A sinusoidal graph has a maximum at the point (5, 12) and a minimum at the point
(12, 5). Determine the midline of the graph.
A. | y = 0 | B. | y = 5 | C. | y =
12 | D. | y = 8.5 |
|
|
|
19.
|
A sinusoidal graph has a maximum at the point (4, –8) and the next minimum
is at the point (7, –10). Determine the period of the graph.
|
|
|
20.
|
Select the function with the greatest maximum value.
A. | y = 2 sin 3(x + 90°) + 5 | B. | y = 3 sin
2(x – 90°) – 3 | C. | y =  sin (x +
90°) – 1 sin (x +
90°) – 1 | D. | y = sin 0.5(x –
90°) |
|
|
|
21.
|
Determine the amplitude of the following function.
y = 3 sin
2(x + 90°) – 1
|
|
|
22.
|
Determine the amplitude of the following function. y = cos  x x + 12 A. |  | B. | 1 | C. | 2 | D. | 12 |
|
|
|
23.
|
Determine the period of the following function. y = cos  x x + 12 A. | 180° | B. | 360° | C. | 720° | D. | 1080° |
|
|
|
24.
|
Determine the midline of the following function.
y = 3 sin 2(x
+ 90°) – 1
A. | y = 2 | B. | y = 3 | C. | y =
0 | D. | y = –1 |
|
|
|
25.
|
Determine the midline of the following function. y = cos  x x + 12 A. | y = 12 | B. | y = 3 | C. | y =
4 | D. | y = 0 |
|
|
|
26.
|
Determine the range of the following function. y = cos  x x
+ 12 A. | {y | 11 £ y £ 13, y Î R} | B. | {y | –4
£ y £ 4, y Î R} | C. | {y | 9 £
y £ 15, y Î
R} | D. | {y | y Î
R} |
|
|
|
27.
|
Determine the range of the following function.
y = 0.5 sin (x
– 2)
A. | {y | –3 £ y £ –1, y Î
R} | B. | {y | –0.5 £ y £ 0.5, y Î R} | C. | {y | –2
£ y £ 2, y Î R} | D. | {y | y Î R} |
|